
Keyword
level of activity
4 record(s)
Type of resources
Available actions
Topics
Keywords
Contact for the resource
Provided by
Formats
Representation types
Update frequencies
Status
Scale
panaceaKeywords
GEMET keywords
-
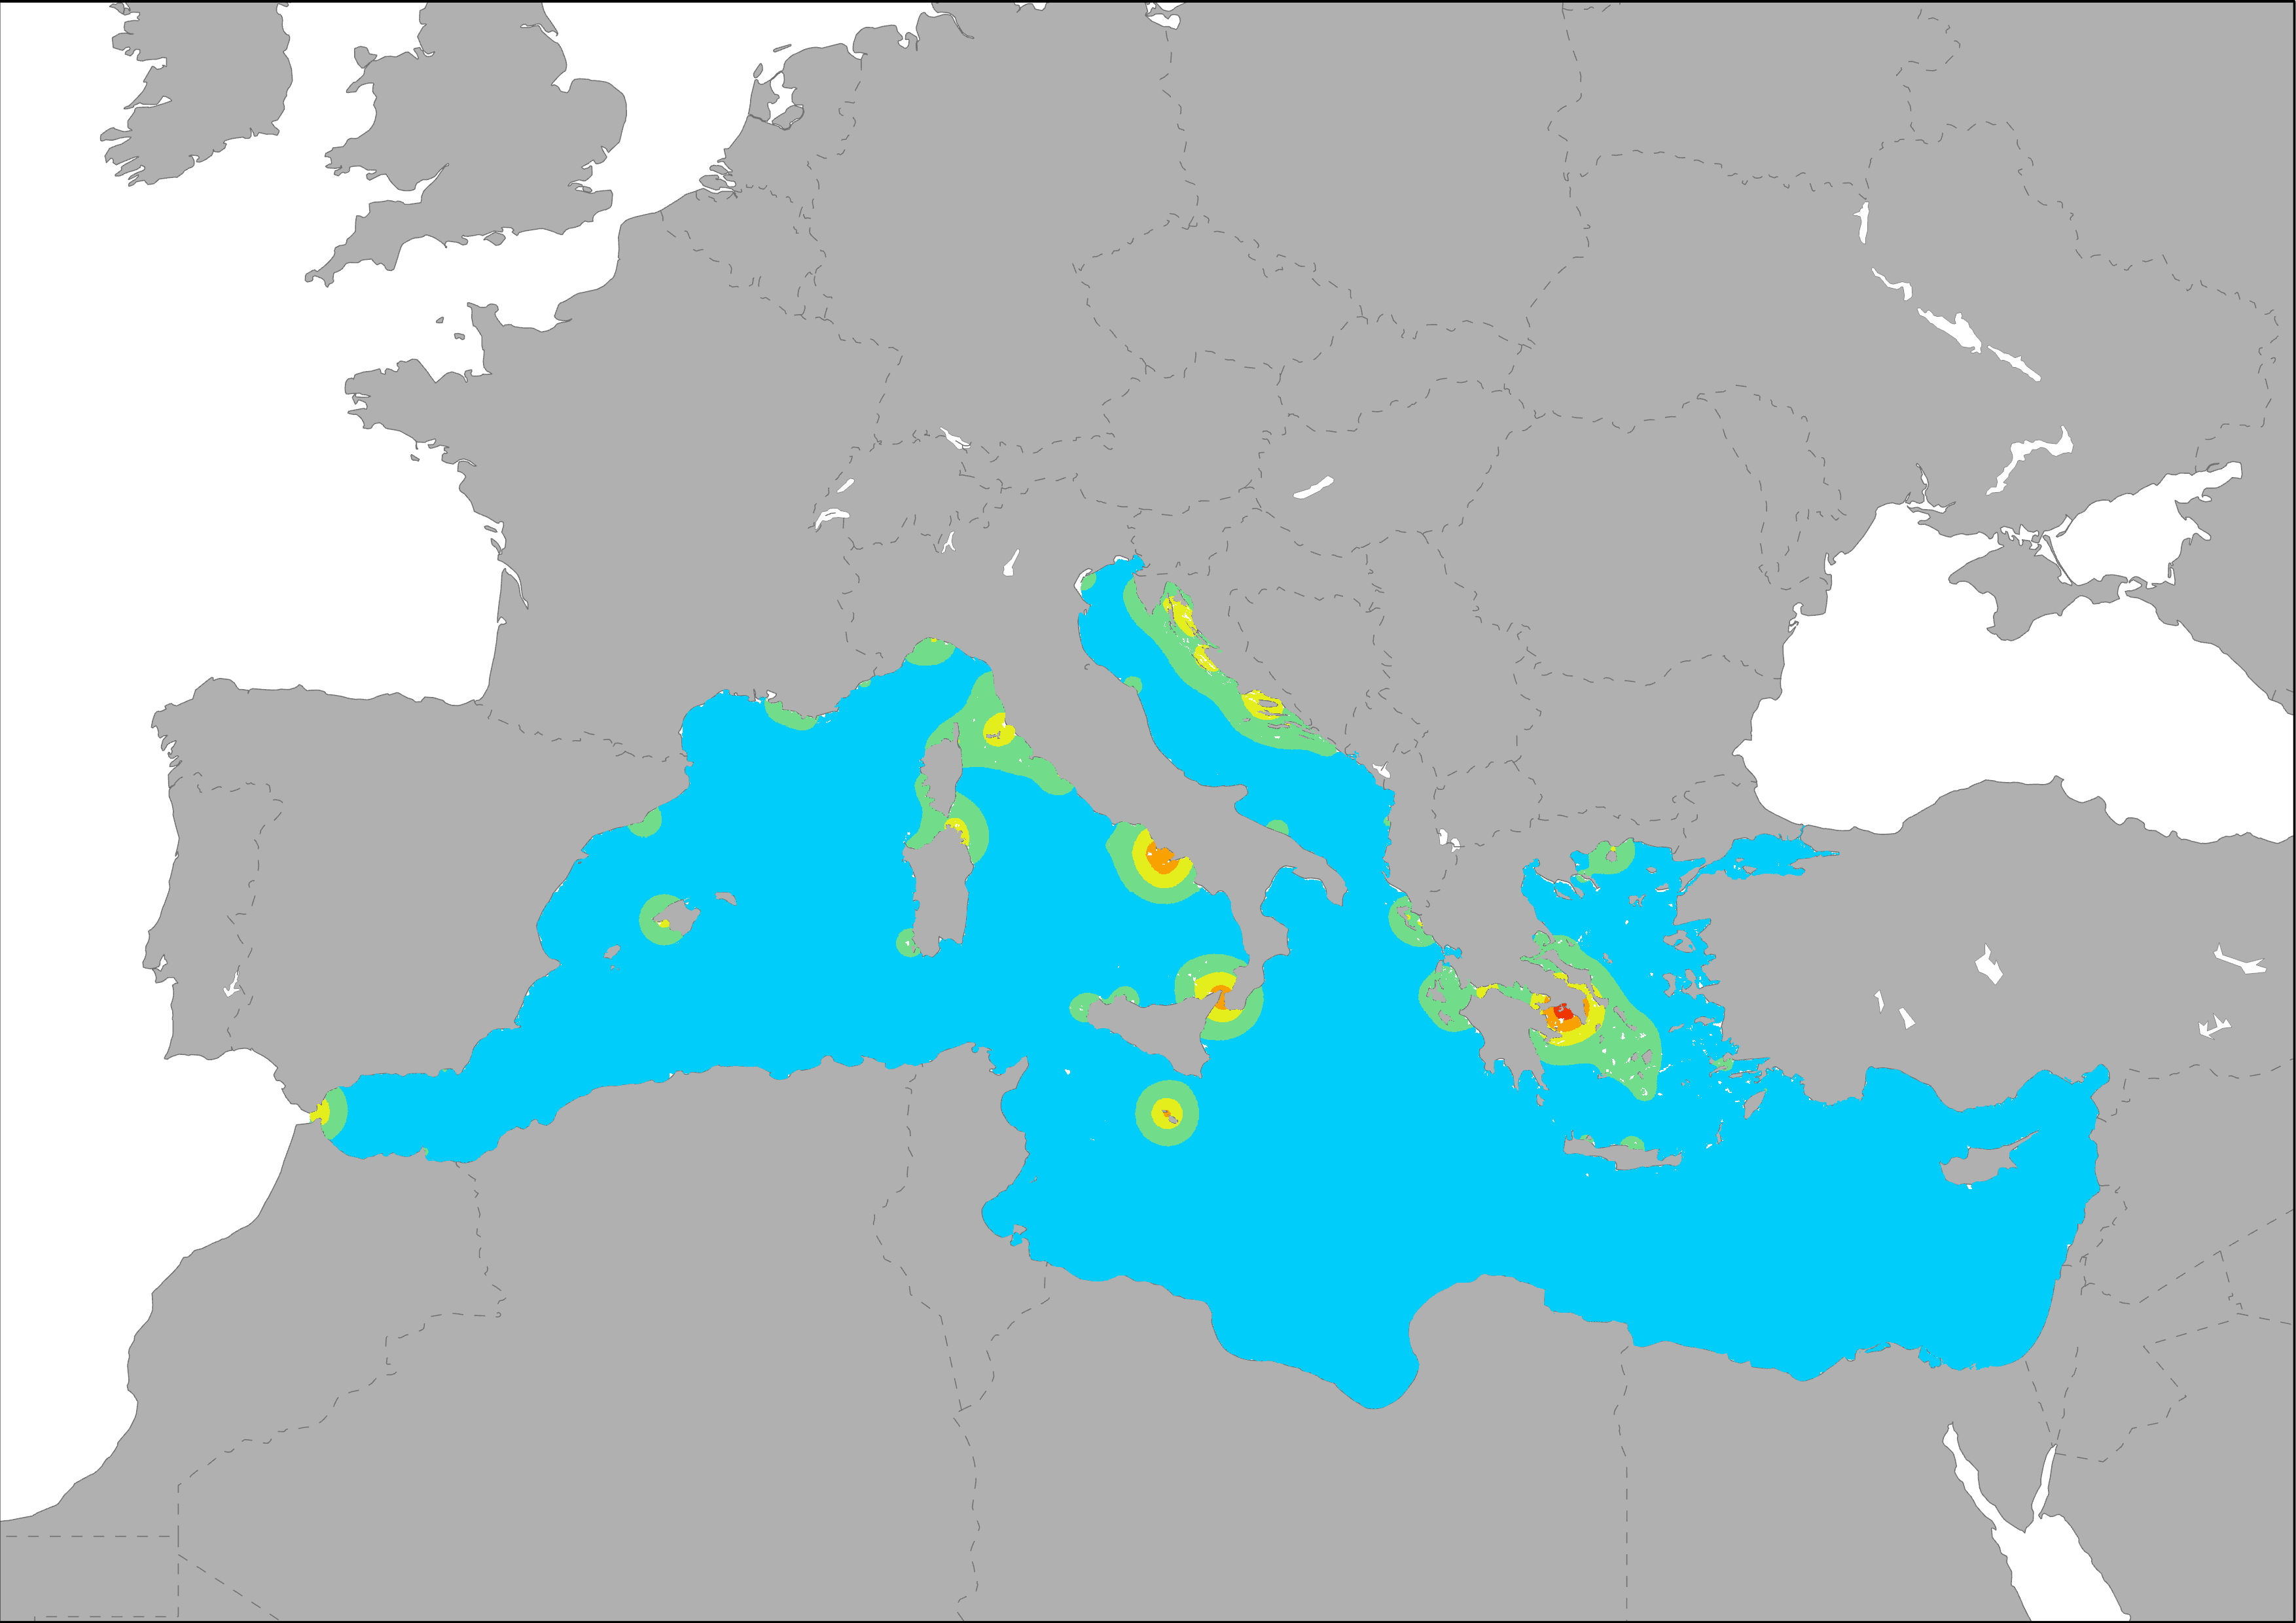
The map shows the distribution of main passengers transport ports in the Mediterranean Sea. Pressure on marine regions are represented by the port influence area, based also on their activity level. The dispersal of port-derived pollution was modeled as a diffusive plume based on their activity level using Eurostat data on transport of goods (thousand tonnes) and passengers (thousand passengers). Calculations were made following the same methodology developed for ESaTDOR Project (ESPON, 2013).
-
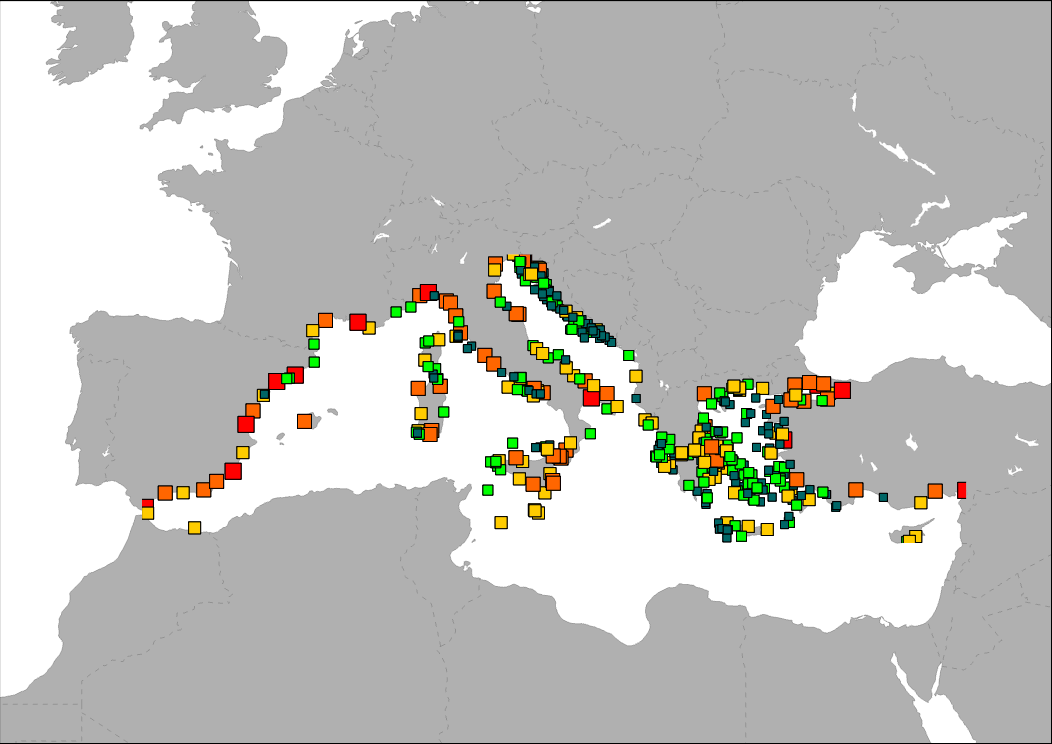
The map shows the distribution of main goods transport ports in the Mediterranean Sea. Ports are classified in groups according to its level of activity.
-
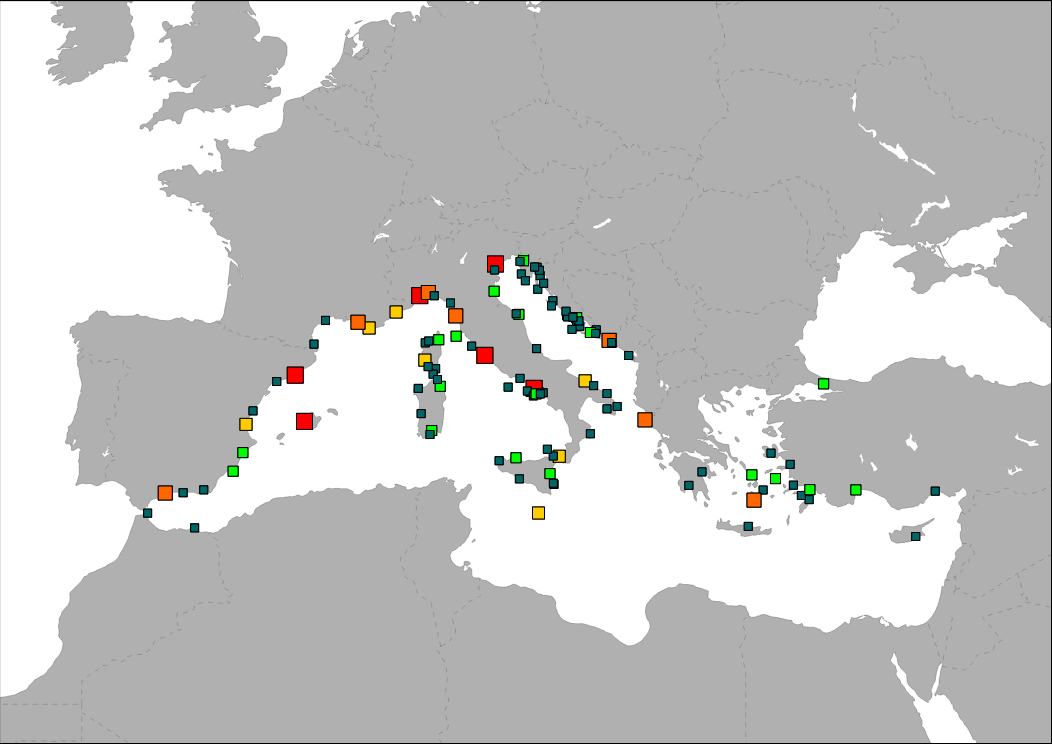
The map shows the distribution of main cruise ports in the Mediterranean Sea. Ports are classified in groups according to its level of activity.
-
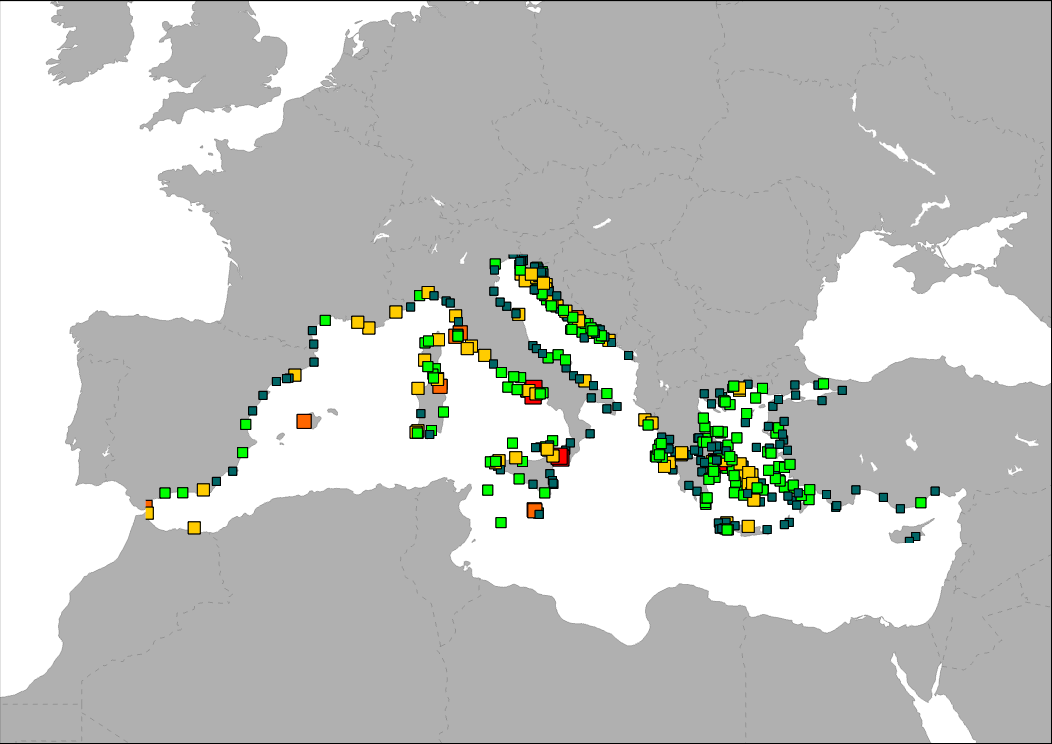
The map shows the distribution of main ferry ports in the Mediterranean Sea. Ports are classified in groups according to its level of activity.